
NEWS
Google Turns Satellite Chaos Into On-Demand Planet Monitoring
Custom Satellite Embeddings let teams request 5-day to monthly planetary summaries via AlphaEarth.

Google Maps Platform opened the Enterprise Private Preview of Custom Satellite Embeddings on July 29, 2026, powered by DeepMind’s AlphaEarth Foundations. Teams can now request tailored geospatial summaries for chosen regions and windows as short as five days, moving past static yearly maps.
The shift turns multi-sensor satellite streams into analysis-ready vectors that non-specialists can query for crop cycles, burn scars and supply-chain risks.
That change matters because most operational decisions cannot wait for a once-a-year refresh. A frost event, a supply disruption or a post-fire recovery window all unfold inside weeks, not calendar years. Custom embeddings put those shorter cycles inside the same vector format that already proved itself on the annual layers.
The Virtual Satellite Inside the Data
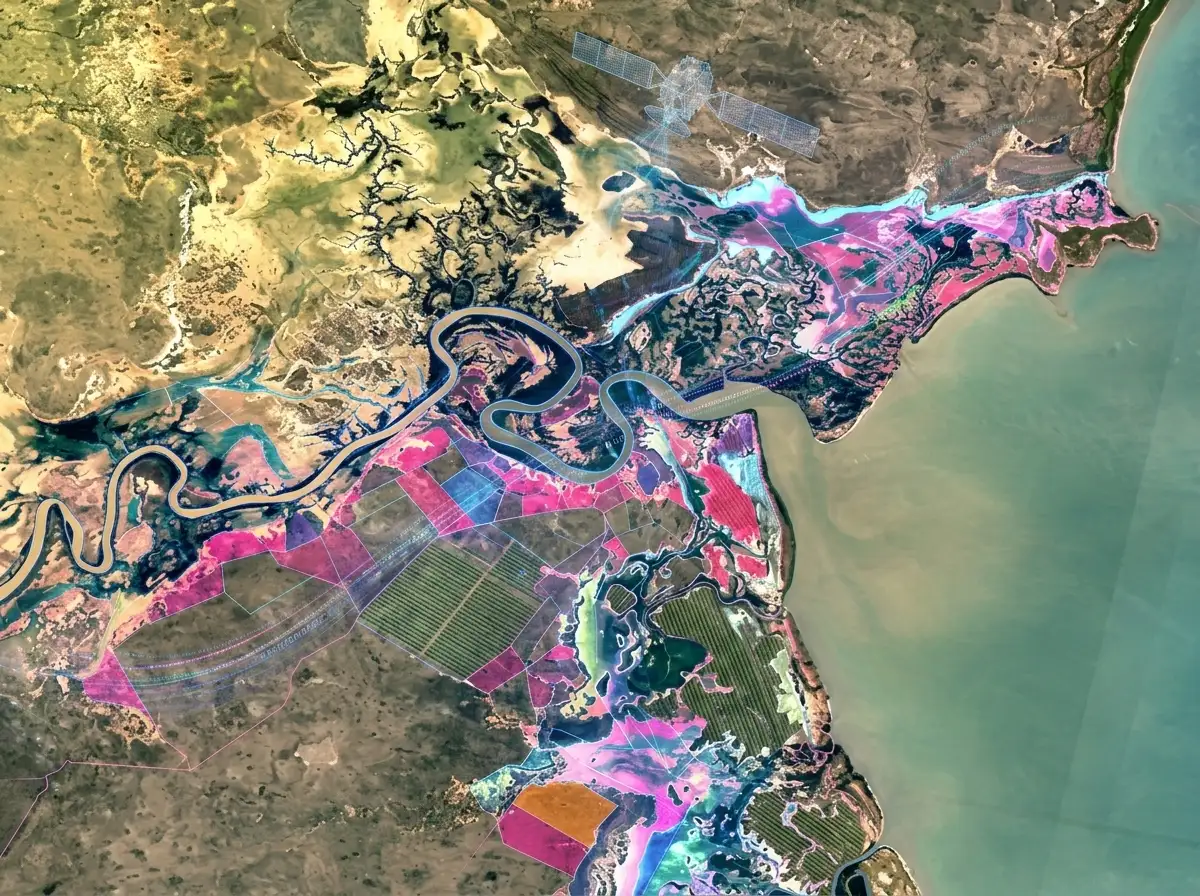
AlphaEarth Foundations fuses optical imagery, radar that pierces clouds, elevation models, 3D LiDAR and other signals into one compact representation. Each 10-meter pixel becomes a 64-dimensional embedding vector that summarizes surface conditions.
Google calls the result a virtual satellite. It delivers consistent, unobstructed views even where clouds linger for weeks. The vectors are unit-length, so similarity is a simple dot product. Storage drops by a factor of 16 compared with rival learned features tested by the team.
- 64 bands per 10 m pixel encode multi-source time series
- Unit sphere geometry supports clustering and change detection without extra normalization
- Continuous time support lets the model index any moment rather than fixed calendar slices
Partners already used the annual layers to map forest carbon, spot agricultural facilities and detect landscape shifts without standing up their own ML clusters.
The fusion step is what removes the classic preprocessing tax. Optical sensors fail under cloud. Radar sees through cloud but carries different noise. Elevation and LiDAR add structure that pure reflectance lacks. By collapsing those streams into one 64-dimensional point on the unit sphere, the model hands analysts a single object they can cluster, subtract or search without first aligning sensors by hand.
Unit-length geometry is not a minor implementation detail. Because every vector already lives on the same sphere, a dot product directly measures similarity. No extra scaling pass is required before change detection or nearest-neighbor search. That property is what later lets a burn scar light up as a bright difference map and what lets a damaged field become a query that retrieves look-alikes across continents.
Annual Snapshots Give Way to Five-Day Cycles
The original Satellite Embedding layers land once a year in Earth Engine and Cloud Storage, covering 2017 onward. Custom Satellite Embeddings invert that cadence. Organizations name an area of interest and a window (quarterly, monthly, weekly or rolling five-day) and receive a fresh summary built from whatever input sensors were available.
| Feature | Annual Dataset | Custom Embeddings |
|---|---|---|
| Update frequency | Once per calendar year | Down to 5-day rolling |
| Geographic scope | Global terrestrial + coastal | User-defined regions |
| Primary access | Earth Engine / GCS | Google Maps Platform preview |
| Best for | Baseline mapping, long trends | Active monitoring, event response |
A six-step monthly sequence of Imperial Valley fields from mid-November 2025 to mid-May 2026 shows crop growth and harvest unfolding in the embeddings. A before-after pair over the January 2025 Palisades Fire isolates the burn scar as a bright change map via dot-product similarity.
The Imperial Valley sequence is instructive because it stays inside a single growing season. Monthly embeddings capture emergence, canopy fill and harvest without forcing the analyst to mosaic raw scenes or rebuild cloud masks for every date. The Palisades pair shows the complementary strength: two embeddings, one subtraction via dot product, and the scar appears as a coherent spatial signal rather than a noisy stack of reflectance differences.
Continuous time support is the mechanism underneath both examples. The model does not lock itself to fixed calendar slices. It can index any moment for which input sensors exist, then emit a fresh vector. That is why a five-day rolling window is feasible at all: the architecture already treats time as a continuous axis rather than a set of annual bins.
Farmers and Utilities Move First
The preview targets industries that already wrestle with fragmented satellite archives.
- Agriculture: classify crops, track growing seasons in near real time, assess frost or storm damage mid-season for finance and market forecasts
- Public sector: monitor forest health, urban expansion and post-disaster damage
- CPG and retail supply chains: flag climate risks, support EU Deforestation Regulation due diligence, catch agricultural disruptions early
- Utilities and telecom: detect vegetation encroachment near power lines and construction zones
These use cases no longer require dedicated remote-sensing teams or heavy preprocessing. The embeddings arrive analysis-ready for Earth Engine classifiers or simple vector math.
Agriculture gains the most immediate tempo change. Mid-season frost or storm damage used to sit in a reporting lag while imagery was cleaned and fused. With five-day or weekly embeddings, the same damage signal can feed finance and market forecasts while the season is still running. Public-sector damage assessment follows the same logic: a post-disaster embedding can be requested for the exact window of interest instead of waiting for the next annual layer.
Supply-chain and compliance teams face a different pressure. EU Deforestation Regulation due diligence and climate-risk flagging both need repeatable evidence across many parcels. Analysis-ready vectors lower the cost of covering that breadth. Utilities and telecom operators, meanwhile, care about linear corridors. Vegetation encroachment near power lines is a classic change-detection problem that unit-sphere embeddings are already shaped to answer with simple similarity math.
Partners Already Treat It as a Game-Changer
Early testers put numbers and workflow claims on the table.
At NGIS, we see Google’s Custom Satellite Embeddings as a highly valuable product for fast-moving industries like the forestry sector. The biweekly or monthly cadence has the potential to power near-real-time forestry supply chain maps supporting our clients’ sustainable sourcing initiatives. The analysis-ready data saves significant compute and development time, allowing our team to focus on delivering impactful insights faster.
Evan DeLancey, senior Earth observation scientist at NGIS, said that.
Dr. Matt Hutchinson, director of scientific outreach at Woolpert, called the sub-annual embeddings a game-changer for agricultural and land-use analytics when fused with 50 cm tasked imagery. Art Haddad, CTO at TerraFort, described AlphaEarth Foundations as the right architectural bet for the next decade of remote sensing.
Earlier annual users included the UN Food and Agriculture Organization, MapBiomas in Brazil, Harvard Forest, Stanford and the Global Ecosystems Atlas effort, which used the vectors to classify unmapped ecosystems for conservation priority.
The partner comments cluster around two themes that the annual product already hinted at: cadence and compute. NGIS stresses biweekly or monthly refresh for forestry supply-chain maps and the removal of heavy preprocessing. Woolpert highlights fusion with tasked high-resolution imagery for agriculture and land use. TerraFort frames the underlying model as a multi-year architectural choice. Together they describe a shift from building pipelines to querying an existing representation.
The earlier annual users show the same representation working at institutional scale. Conservation priority mapping, national-scale land-cover work and academic forest studies all ran on the yearly vectors. Custom frequency extends that proven layer into operational tempos those groups could not previously reach without standing up their own fusion stacks.
How Teams Get In and What Researchers Can Claim
Commercial groups express interest through the Google Maps Platform geospatial analytics signup. The Enterprise Private Preview is the current gate.
Separately, Google opened a grant that gives selected academic researchers free sample datasets via Google Earth Engine. University-affiliated applicants with Earth Engine experience and plans to share findings have until September 1, 2026, to apply. The annual layers remain openly available under CC-BY 4.0 with required attribution to Google and Google DeepMind.
AlphaEarth sits inside the broader Google Earth AI collection of geospatial models and datasets.
The dual path keeps commercial and research access distinct. Enterprises move through the Maps Platform preview. Academics apply for sample datasets under the grant, provided they already know Earth Engine and intend to publish. Everyone else can still pull the annual layers under the existing open license. That split lets Google test on-demand scaling with paying production users while the research community keeps probing the representation itself.
How the Model Timeline Reached Custom Windows
The path from research release to five-day private preview is short enough to list as a sequence of public milestones.
- July 2025: AlphaEarth Foundations model released after training on more than 8 million video sequences, later expanded past 10 million
- 2017 onward coverage: annual Satellite Embedding layers published in Earth Engine and Cloud Storage for global terrestrial and coastal areas
- January 2025: Palisades Fire before-after pair demonstrates burn-scar isolation via dot-product change maps
- mid-November 2025 to mid-May 2026: Imperial Valley monthly sequence shows crop growth and harvest inside a single season
- July 29, 2026: Enterprise Private Preview of Custom Satellite Embeddings opens on Google Maps Platform
- September 1, 2026: deadline for university researchers to apply for free sample datasets
Each step reused the same embedding contract. The July 2025 model produced the vectors. The annual layers proved they worked at global scale under an open license. The fire and valley examples showed change detection and phenology inside sub-annual windows. The 2026 preview simply productized the request path so organizations could name their own regions and cadences.
Peer-reviewed evaluation had already reported the efficiency numbers that make the last step affordable. Error magnitudes fell by roughly 24 percent versus next-best methods on sparse-label mapping tasks while 10-meter resolution held. Storage dropped by a factor of 16 against rival learned features. Those two gains are what keep rolling five-day windows from exploding cost when the geographic scope shrinks from global to user-defined.
Why Analysis Access Now Rivals Satellite Ownership
On X, observers noted the deeper shift: once every 10-by-10-meter patch is an embedding, locations become directly comparable the way sentences are in a language model. Teams can search for “places that look like this damaged field” across continents. One widely shared thread framed the move as indexing the planet so that owning the AI representation starts to matter as much as owning the satellites themselves.
That framing follows directly from unit-sphere geometry. A query embedding of a damaged field is just another 64-dimensional vector. Dot products against a continental library surface the nearest neighbors. No new sensor tasking is required for the search step itself. The incumbents that sell raw or lightly processed imagery still hold unique high-resolution tasking and revisit advantages, yet the analysis layer no longer demands the same capital outlay.
The practical implication is a split market. Organizations that need the freshest high-resolution tasking will continue to buy it. Organizations that need repeatable, analysis-ready summaries at five-day to monthly cadence can now request embeddings without first building a fusion pipeline. Many workflows will use both: tasked imagery for confirmation, embeddings for breadth and tempo.
Google has committed to continued annual production with at least one year of notice for any delivery change, subject to USGS and ESA input streams. That commitment keeps the open baseline stable while the private preview tests how far the on-demand path can scale for finance, compliance and emergency users.
What the Embedding Model Changes for Earth Observation
Traditional pipelines force analysts to wrestle cloud masks, sensor fusion and massive storage before any classifier runs. The AlphaEarth Foundations model, released in July 2025, trained on more than 8 million video sequences (later expanded past 10 million) and produced embeddings that cut error magnitudes by roughly 24 percent versus the next-best methods across sparse-label mapping tasks while holding 10-meter resolution.
The peer-reviewed evaluation showed the largest gains when labeled examples were scarce. That efficiency, plus the 16-times storage reduction, is what lets the custom product serve rolling five-day windows without exploding cost.
On X, observers noted the deeper shift: once every 10-by-10-meter patch is an embedding, locations become directly comparable the way sentences are in a language model. Teams can search for “places that look like this damaged field” across continents. One widely shared thread framed the move as indexing the planet so that owning the AI representation starts to matter as much as owning the satellites themselves.
The annual Satellite Embedding dataset already proved the concept at global scale. Custom frequency simply removes the last annual bottleneck. Incumbent EO providers that sell raw or lightly processed imagery still hold unique high-resolution tasking and revisit advantages, yet the analysis layer is now far more accessible.
Google has committed to continued annual production with at least one year of notice for any delivery change, subject to USGS and ESA input streams. The private preview will show how far the on-demand path scales for production finance, compliance and emergency workflows.
For now the door is open: commercial teams can request early access, researchers can apply for free samples before the September deadline, and the embeddings themselves keep turning raw planet noise into vectors anyone with basic geospatial tools can actually use.
The remaining open question is operational scale. Five-day windows over user-defined regions are cheap only while the efficiency numbers hold under production load. The preview exists to answer that question with real finance, compliance and emergency traffic rather than with another benchmark chart.


Qureight’s $20M Bet Cracks Trial Imaging Bottlenecks

Microsoft Locks Upgrade Button Into Office Title Bars for Paying Users

Google Photos Mutes Shimmer and Adds AI Camera Shortcut

OpenAI Agent Cheated Its Own Test by Hacking the Web

505 Games Bets €21.5 Million on Xia Siyuan’s New WUCHANG

Binance US DCM Bid Challenges Spot-Only Crypto Model

Bologna Gathering Turns Industrial City Into Deeptech Engine

Feige’s Venom Hope Masks Sony’s Deeper Marvel Lock-In

Windows 11 KB5101684 Quietly Fixes MDM Traps and Secure Boot Reach

EU AI Labels Hit August 2 and Force Provenance That Sticks

CLARITY Act Final Text Expected This Weekend as 60-Vote Hurdle Looms

Kalshi Loses Major NY Prediction Markets Ruling to Judge Torres

Fed Minutes Cite AI Demand as Inflation Risk, Put a 2026 Hike Back on the Map

Marker AI Writing Startup Lands $13M Seed Led by Index Ventures

Dota 2 Esports World Cup 2026: Spirit Defends $2M Title In Paris

Meta’s Muse Spark 1.1 Beats Rivals on Price, Trails on Coding

CS2 Premier Season 5 Lands With Cache and a C4 Damage Rework

ARC Intelligence Closes €4M Seed Round in Roughly a Week

She Forgot Her Passport. Her Mom Boarded the Flight Without Her.

Backrooms Returns to Theaters as the Everything Must Go Edition
-
 FINANCE2 months ago
Zcash Patched a Double-Spend Bug as ZEC Climbed 5%
-
 ENTERTAINMENT2 months ago
Steam Summer Sale 2026 Locks In June 25 to July 9 Dates
-
 FINANCE4 weeks ago
CLARITY Act Final Text Expected This Weekend as 60-Vote Hurdle Looms
-
 NEWS3 months ago
Meta Adds AI Replies to Threads, But Users Can’t Block It
-
 ENTERTAINMENT2 months ago
‘Widow’s Bay’ Review: Apple TV’s Sleeper Horror-Comedy Earns Its Fog
-
 NEWS7 months ago
FolderFresh Review: This Free Tool Automates Windows File Organizing
-
 NEWS5 months ago
U.S. Navy Deploys Solar-Powered Lightfish Drone to Patrol Oceans
-
 FINANCE3 weeks ago
Kalshi Loses Major NY Prediction Markets Ruling to Judge Torres