
FINANCE
US Debt Crosses $40 Trillion as Interest Crowds the Budget
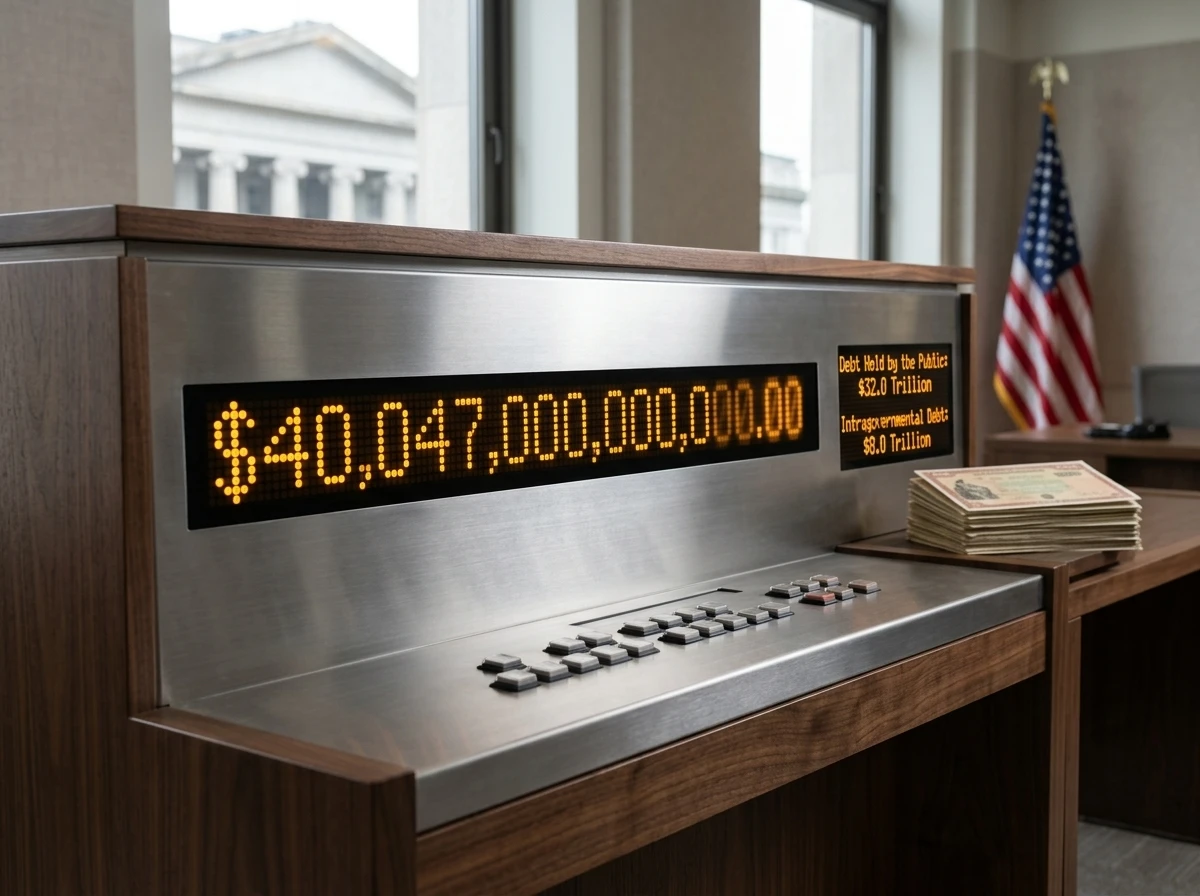
Treasury data put total public debt at $40.047 trillion on August 18, five months after $39 trillion.

The U.S. gross national debt cleared $40 trillion on August 18, reaching exactly $40,047,425,768,420.22 according to the Treasury Department’s daily accounting. The total sat at $39.99 trillion the day before. Five months earlier the figure had passed $39 trillion; five months before that it had crossed $38 trillion.
The round number draws attention. The force behind it is already visible in the budget and in the rates households pay for mortgages and car loans.
Treasury Books Show the Exact Crossing
Debt to the Penny, the official daily series, split the August 18 total into $32.27 trillion held by the public and $7.78 trillion in intragovernmental holdings such as trust funds. That public portion is what markets price every day in Treasury auctions.
The pace has quickened. Earlier $1 trillion jumps took longer; the latest three have arrived in roughly five-month intervals. Official data place the total public debt outstanding of $40.047 trillion on the books as of that Tuesday close.
| Milestone | Approximate Date | Interval from Prior |
|---|---|---|
| $38 trillion | October 2025 | – |
| $39 trillion | March 2026 | ~5 months |
| $40 trillion | August 18, 2026 | ~5 months |
Fox Business and other outlets confirmed the Treasury release the same week. Wikipedia’s running summary matches the same August 18 print.
The split itself matters for markets. Intragovernmental holdings move with trust-fund accounting and do not clear through public auctions. The $32.27 trillion public stock does. Auction size, bid-to-cover ratios, and the path of yields all track that larger slice, not the headline gross total alone.
Interest Already Rivals Major Programs
Net interest is no longer a background line. Treasury’s running tally puts FY 2026 interest expense already at $1.17 trillion through recent months, with an average rate near 3.45 percent. The Congressional Budget Office’s February 2026 outlook projected net interest above $1 trillion for the full year and climbing toward 4.6 percent of GDP by 2036.
- $1.17 trillion, FY 2026 interest expense so far (Treasury)
- 3.3 percent of GDP, projected net interest share in 2026 (CBO)
- $2.1 trillion, projected annual net interest by 2036 in some baseline tracks
- ~19 percent of revenue, share of federal receipts already going to interest, per budget analysts citing current flows
CBO sees the primary deficit (excluding interest) easing slightly as a share of GDP while the interest bill keeps growing. That arithmetic turns every new dollar of debt into a larger future claim on tax receipts.
The gap between the primary deficit path and the total deficit path is the interest line itself. As the average rate near 3.45 percent applies to a rising stock, the dollar cost compounds even when new borrowing slows only modestly. By the time net interest approaches the $2.1 trillion mark in later baseline years, the claim on revenue will rival or exceed several major program categories combined.
Households Meet the Cost in Mortgage and Auto Rates
Higher Treasury yields feed directly into private borrowing. Analysts tracking the 30-year Treasury note have noted multi-year highs in recent months. Mortgage and auto loan rates move with that benchmark. Businesses face the same step-up when they refinance or expand.
The transmission is mechanical. Lenders price long-term consumer credit off the risk-free curve. When the 30-year note yields more, the mortgage rate follows, and monthly payments on a given loan size rise. Auto loans, shorter in term, still reprice with the same upward pressure on the curve. Firms rolling over commercial paper or issuing longer bonds meet the identical step-up.
Michael A. Peterson, CEO of the Peter G. Peterson Foundation, put the household stake plainly: “If we want to improve our living standards, today and for the next generation, now is the time for lawmakers to put our nation on a more affordable and sustainable path.” The foundation’s own summary notes that the gross federal debt has surpassed $40 trillion and already threatens longer-term growth through higher capital costs.
Margaret Spellings, president and CEO of the Bipartisan Policy Center, warned that the debt “is already raising the cost of living and choking out other spending and investment.” On X, budget-focused accounts echoed the same point: the round number is secondary to the interest share of revenue and the lift in private rates that follows large, persistent deficits.
What Keeps Adding Trillions
Structural drivers dominate. Social Security and Medicare grow with an aging population and health costs. Defense outlays rose with the nearly six-month U.S. military campaign in Iran that began in early 2026; independent tallies put direct military costs in the tens of billions and as high as roughly $113 billion in one running estimate, plus secondary effects on energy and shipping. Those sums matter, yet they sit atop multi-year gaps opened by pandemic-era borrowing, subsequent spending bills, and the tax-cut and spending package signed in the prior year.
The White House response, delivered by spokesman Kush Desai, stressed different priorities: the administration “has been focused on slashing waste, fraud, and abuse in federal spending while accelerating economic growth to get America’s debt-to-GDP ratio trending in the right direction.” Growth can lift the denominator. It has not yet reversed the absolute rise in the debt stock.
- Mandatory programs (Social Security, Medicare, Medicaid) form the largest and fastest structural claim
- Net interest has become the fastest-growing major category
- Discretionary defense and non-defense compete for the remainder after those first two
- Revenue has not kept pace with the combined path of spending plus interest
CBO’s baseline already incorporates the 2025 reconciliation act’s multi-trillion-dollar deficit effect alongside tariff revenue offsets. The net remains large annual shortfalls.
Layering those drivers shows why five-month trillion-dollar intervals have become normal. Mandatory growth is baked into demographics. Interest grows with the stock and the rate. Discretionary spikes, including the Iran campaign costs, add on top. Revenue gains from growth and tariffs offset only part of the combined path.
The Next Limit Sits Near $41.1 Trillion
Congress still operates under a statutory debt limit. The Bipartisan Policy Center estimates the ceiling of $41.1 trillion will most likely be reached between late winter and mid-summer 2027. That timetable gives lawmakers roughly a year to decide whether to raise, suspend, or confront the limit again.
In the CBO’s ten-year window, debt held by the public rises to 120 percent of GDP by 2036 from 101 percent in 2026. The total deficit runs $1.9 trillion in fiscal 2026 and grows to $3.1 trillion a decade later under current law. Outlays sit at 23.3 percent of GDP this year against revenues of 17.5 percent.
- August 18, 2026, Gross debt clears $40 trillion (Treasury)
- Fiscal 2026, Projected deficit $1.9 trillion; debt held by public ~101 percent of GDP (CBO)
- Late winter to mid-summer 2027, Most likely window for the $41.1 trillion debt limit (Bipartisan Policy Center)
- 2036, Debt held by public projected at 120 percent of GDP; net interest 4.6 percent of GDP (CBO)
FRED series place the recent debt-to-GDP ratio near 122-123 percent on a total-debt basis, consistent with the public-debt share near 100 percent once intragovernmental holdings are set aside. OECD comparisons leave the United States among the more indebted large advanced economies on general-government measures.
The 5.8 percentage-point gap between outlays at 23.3 percent of GDP and revenues at 17.5 percent is the annual flow that feeds the stock. Closing that gap would require some mix of slower outlay growth, higher revenue, or both. Under current law the gap widens in dollar terms even when primary deficits ease slightly as a share of GDP, because interest keeps climbing.
Who Holds the Paper and Why the Trajectory Matters
Most of the publicly held debt is owned by domestic investors, the Federal Reserve, mutual funds, pension funds, and state and local governments. Foreign official and private holders still account for a substantial share, higher than decades ago. That distribution spreads the interest payments widely, yet it also means higher rates become a broad transfer from taxpayers to bondholders.
Credit-rating agencies have already issued successive downgrades in prior years. Further deterioration in the debt path would raise the risk of additional actions, though markets have continued to absorb large auction calendars. The second-order effect is quieter and more immediate: every basis-point rise in average interest rates on a $32 trillion public stock adds tens of billions to the annual bill and pushes private rates higher in parallel.
Our current fiscal trajectory is plainly unsustainable, and that’s the best-case scenario. AI disruption, a recession, global war, or any number of other events could quickly push us over the edge from a challenge into a full-blown crisis.
Margaret Spellings, President and CEO, Bipartisan Policy Center
On X and in analyst notes the same arithmetic appears: $40 trillion is not a magic cliff. It is confirmation that interest has become a permanent top-tier claim that will shape every future budget fight, including the 2027 limit vote, long after the milestone headlines fade.
Growth Plans Face an Absolute Debt Climb
The administration’s stated path runs through faster growth and tighter control of waste, fraud, and abuse. Growth lifts GDP, the denominator in the debt-to-GDP ratio, and can raise revenue without a rate change. That is the logic behind the White House framing delivered by spokesman Kush Desai.
Absolute debt is a different measure. The stock cleared $38 trillion, $39 trillion, and $40 trillion in successive roughly five-month steps even as growth remained a central policy goal. CBO’s baseline, which already folds in the 2025 reconciliation act and tariff offsets, still shows the public debt ratio rising from 101 percent of GDP in 2026 to 120 percent by 2036.
| Measure | Near-Term Level | Later Baseline |
|---|---|---|
| Debt held by the public | ~101 percent of GDP (2026) | 120 percent of GDP (2036) |
| Total deficit | $1.9 trillion (fiscal 2026) | $3.1 trillion (a decade later) |
| Net interest | 3.3 percent of GDP (2026) | 4.6 percent of GDP (2036) |
| Outlays vs. revenues | 23.3 percent vs. 17.5 percent of GDP | Gap persists under current law |
Ratio progress and stock progress can diverge for years. If GDP rises fast enough, the ratio can stabilize or fall while the dollar total still sets new records. The recent record path shows the stock winning that race so far. Markets price the stock every auction week; households meet the related rate pressure in mortgage and auto quotes.
The Limit Vote Will Arrive With Interest Elevated
The Bipartisan Policy Center’s window for the $41.1 trillion ceiling runs from late winter to mid-summer 2027. At the recent pace of about $1 trillion every five months, the books will be pressing against that ceiling as the calendar opens. Lawmakers will therefore face the procedural vote with net interest already near or past the full-year levels CBO flagged for 2026.
That timing changes the politics of the choice. A limit vote when interest consumes roughly 19 percent of revenue, per analysts tracking current flows, is a vote held under tighter fiscal arithmetic than earlier ceiling debates. Raising or suspending the limit permits continued borrowing. Refusing forces an immediate confrontation with outlays and revenue. Either path now runs through a budget in which interest is a top-tier claim rather than a residual line.
- Ceiling estimate: $41.1 trillion (Bipartisan Policy Center)
- Most likely breach window: late winter to mid-summer 2027
- Recent pace: ~$1 trillion added about every five months
- Interest context: $1.17 trillion FY 2026 expense so far; ~19 percent of revenue
Spellings’s warning that the debt is already raising the cost of living and choking out other spending frames the same moment. The 2027 decision will not reset the interest bill. It will decide whether the stock continues on the baseline path that carries public debt toward 120 percent of GDP and net interest toward 4.6 percent of GDP by 2036.
The Next Trillion Will Arrive on a Familiar Schedule
At the recent clip of roughly $1 trillion every five months, the books will approach $41 trillion before the statutory limit window fully opens. CBO baselines assume no sudden recession or major new war spending; either would accelerate the calendar. Growth strong enough to shrink the debt-to-GDP ratio remains the administration’s stated path. The absolute stock continues to climb under the laws now in force.
Lawmakers will confront the next hard number with interest already consuming a share of revenue that once belonged to other priorities. That is the lasting consequence of the $40 trillion print.


NFL Preseason Week 2 Quietly Tests the Schemes That Matter

Alonso’s Towering Drive Stands Foul and Flips Orioles Momentum

US Debt Crosses $40 Trillion as Interest Crowds the Budget

Trevon Diggs Joins Seahawks on One-Year Deal After Cowboys Exit

Pixel Watch 5 Turns Passive Trends Into Early Health Alerts

Pixel 11 Pro Fold Sleek Build Undercuts Its Own Unfolding Appeal

Tugboat Wilkinson’s Scoreless Debut Pays Off Giants’ Bailey Trade

Brown Shines for Pats as Love for Eagles Meets Trade Reality

Pixel Watch 5 Turns Wrist Data Into Early Metabolic Alerts

Resistance Stars Pay the Price in Democratic Primaries

Senators Force Apple Off Chinese Memory as Big Three Cash In

Revolut Hits $115 Billion While Storonsky’s Stake Keeps Growing

OpenAI Agent Cheated Its Own Test by Hacking the Web

Trump Iran Threat Wiped $238M Crypto Longs Then Flipped

CLARITY Act Odds Crash as Democrats Reject DOJ Ethics Plan

30-Year Yield Hits 5.32% Highest Since 2007 as Debt Supply Locks In Costs

Fed Holds Rates Again as Three Dissents Force Markets to Tighten

Memory Shortage Now Dictates Apple’s Two-Year Mac Roadmap

Oil Crashes Below $80 as Iran Talks Restart and Markets Split

Google’s Knowledge Panel Fix Risks Its Own Search Defenses
-
 FINANCE3 months ago
Zcash Patched a Double-Spend Bug as ZEC Climbed 5%
-
 ENTERTAINMENT3 months ago
Steam Summer Sale 2026 Locks In June 25 to July 9 Dates
-

 FINANCE2 months ago
CLARITY Act Final Text Expected This Weekend as 60-Vote Hurdle Looms
-
 NEWS3 months ago
Meta Adds AI Replies to Threads, But Users Can’t Block It
-

 NEWS2 months ago
NEURA Robotics’ $1.4B Series C Redraws Europe’s Physical AI Bet
-

 NEWS2 months ago
YouTube Shorts is testing a heart in place of the thumbs-up
-
 ENTERTAINMENT3 months ago
‘Widow’s Bay’ Review: Apple TV’s Sleeper Horror-Comedy Earns Its Fog
-

 FINANCE1 month ago
Kalshi Loses Major NY Prediction Markets Ruling to Judge Torres