
FINANCE
Soft July Payrolls Echo Rare Fed Pattern as Bitcoin Climbs
Nonfarm payrolls fell 23,000 in July with big downward revisions; Bitcoin rose above $65,000 as history shows the Fed rarely hikes after job losses.

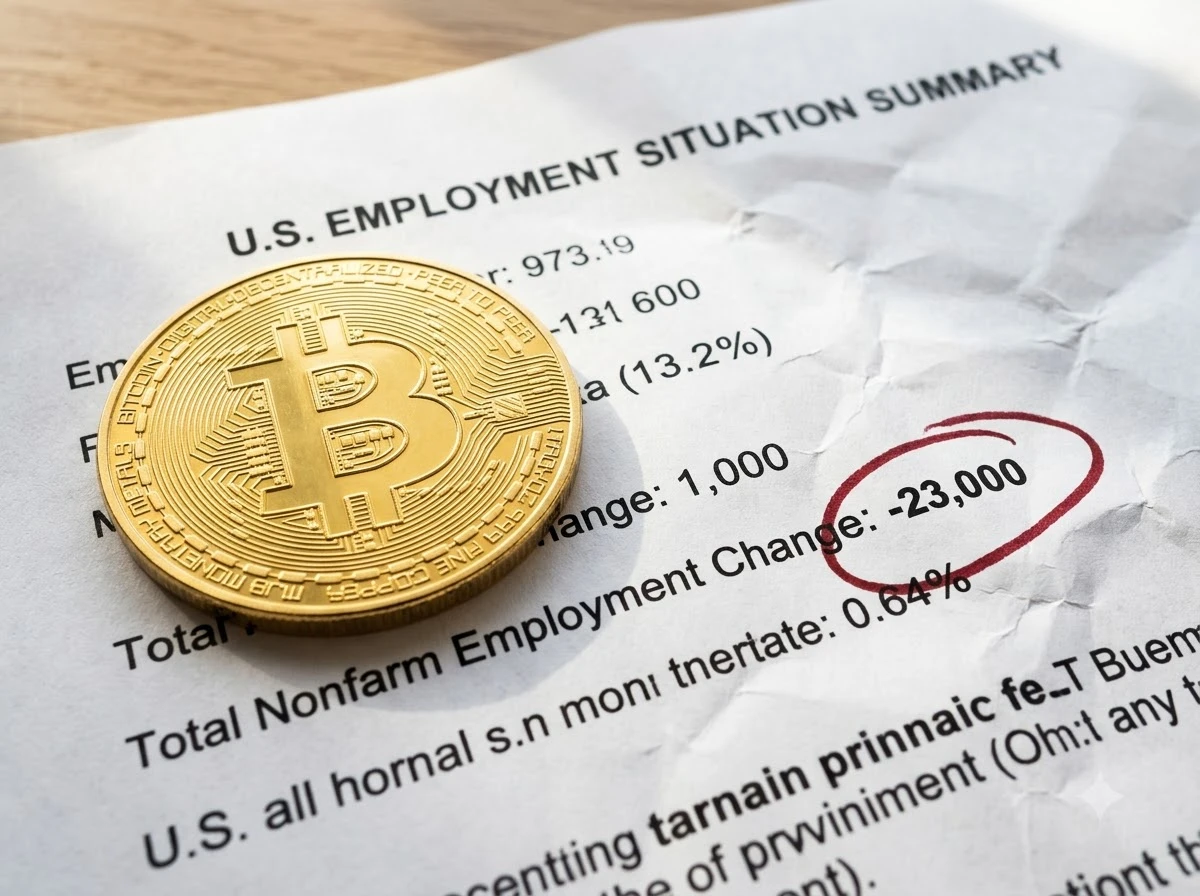
U.S. nonfarm payrolls fell by 23,000 in July, missing forecasts for an 80,000 gain and marking the third-largest monthly loss since 2020. Bitcoin climbed above $65,000 as traders cut odds of a near-term Federal Reserve rate hike.
The BLS July employment situation summary also brought sharp downward revisions and a drop in labor-force participation, framing a familiar late-summer soft patch rather than a sudden collapse. The gap between the headline loss and still-positive private hiring left markets reading the print as dovish, even as several banks kept later hike calls on the books.
What the July Numbers Showed
Total nonfarm employment slipped 23,000 after an average monthly gain of 34,000 over the prior 12 months. June was revised from +57,000 to +20,000 and May from +129,000 to +63,000, leaving the two months 103,000 weaker than first reported. The three-month average now sits near 20,000.
That revision path matters as much as the July miss. A 34,000 twelve-month pace falling to a 20,000 three-month pace shows momentum already cooling before the latest drop. Economists polled by Reuters had expected solid growth; the miss was the largest downside surprise in the survey range.
Unemployment eased to 4.1 percent from 4.2 percent. Average hourly earnings rose just 2 cents to $37.62, or 3.2 percent over the year. The workweek held at 34.3 hours.
| Metric | July 2026 | Prior / Forecast |
|---|---|---|
| Nonfarm payrolls | -23,000 | +80,000 forecast; June revised to +20,000 |
| Unemployment rate | 4.1% | 4.2% in June |
| Labor force participation | 61.4% | near 5½-year low |
| Avg hourly earnings y/y | +3.2% | slowed from 3.4% |
| May+June revision | -103,000 | combined |
The total nonfarm payroll employment series now stands at 158,858,000. Wage growth slowing from 3.4 percent to 3.2 percent removes one near-term price pressure even as the level of employment remains historically high.
Put side by side, the forecast error and the revision shock tell a single story of overstated strength earlier in the spring. July alone did not redefine the cycle; the combined 103,000 May-June cut did as much to reset the baseline.
Private Hiring Held While Government Education Slumped
Private payrolls rose 30,000, matching June. Local government education employment dropped about 50,000, the sharpest decline since late 2021, and drove most of the government sector’s 53,000 loss. Retail trade lost 19,000, concentrated in warehouse clubs and general merchandise. Leisure and hospitality fell 40,000 for a second month, with restaurants and bars off more than 26,000 as the earlier FIFA World Cup boost faded.
- Health care added 22,000, slower than its 36,000 twelve-month average.
- Financial activities shed 14,000 and are down 121,000 from the May 2025 peak.
- Construction gained 22,000 and manufacturing 5,000, helped by AI-related buildouts.
- The share of industries adding jobs slipped to 51.8 percent.
Seasonal quirks around the school calendar have produced soft summer prints three years running. Private-sector momentum looks steadier than the headline, and several economists still describe the market as “slow hire, slow fire.”
The sector split is stark when stacked against the headline. Private gains of 30,000 nearly offset the education-driven government loss, while construction and manufacturing kept adding amid AI-related buildouts. Health care’s cooler 22,000 pace still outran several cyclicals. Breadth at 51.8 percent shows hiring is no longer broad-based, yet it has not flipped into widespread contraction either.
| Sector | July change | Context |
|---|---|---|
| Private payrolls | +30,000 | Matched June |
| Local government education | about -50,000 | Sharpest drop since late 2021 |
| Government total | -53,000 | Education drove most of the loss |
| Leisure and hospitality | -40,000 | Second straight month; World Cup fade |
| Retail trade | -19,000 | Warehouse clubs and general merchandise |
Financial activities remain the clearest soft spot inside private payrolls, down 121,000 from the May 2025 peak after another 14,000 decline. That drag sits alongside steadier goods-side gains and a still-positive private total, which is why the “slow hire, slow fire” label has stuck.
Why the Jobless Rate Fell Anyway
The unemployment rate improved only because 264,000 people left the labor force. Participation dropped to 61.4 percent, its lowest since early 2021, and the employment-population ratio slid to 58.9 percent. Household employment fell 87,000. People working part time for economic reasons rose to 4.8 million.
Key household figures
- Unemployed: 6.9 million, little changed
- Long-term unemployed: 1.8 million (25.5 percent of total)
- Not in labor force but want a job: 5.9 million
- Discouraged workers: 476,000
Immigration enforcement has reduced labor supply; the labor force is down more than a million this year, with foreign-born workers accounting for much of the recent monthly declines. Break-even job growth needed to hold unemployment steady is now estimated as low as 15,000-50,000 a month. That structural shrink means weak payrolls do not automatically signal a classic demand collapse, yet they also limit how fast the economy can expand without wage pressure.
Household and establishment surveys diverged in the usual way. Payrolls fell 23,000 while household employment fell 87,000, and the jobless rate still eased because the labor-force exit was larger still. Long-term unemployment at 1.8 million, or 25.5 percent of the unemployed, keeps a pocket of slack visible even as the headline rate ticks down.
Labor Supply Shrinks the Monthly Break-Even Bar
The supply story now shapes how every payroll print is read. With the labor force down more than a million this year and participation at 61.4 percent, the job growth required to hold unemployment steady has compressed into a 15,000-50,000 monthly band. A headline loss of 23,000 therefore lands closer to that lower bar than it would have in a full-participation cycle.
Mechanism is straightforward. Fewer people in the labor force means fewer jobs are needed to keep the unemployment rate from rising. Foreign-born workers have accounted for much of the recent monthly declines, so the shrink is not only demographic aging. Policy-driven supply loss and softer demand can look similar in a single month’s payroll number.
- Labor force: down more than a million this year, participation at 61.4 percent
- Break-even range: estimated as low as 15,000-50,000 jobs a month
- July payrolls: -23,000 headline, +30,000 private
- Implication: weak headlines no longer map cleanly onto classic demand collapse
The same math limits upside. An economy that cannot draw workers back into the force as easily will hit wage pressure sooner if demand re-accelerates. That is the tension markets and the Fed both face: soft payrolls that argue against near-term hikes, paired with a thinner supply cushion if inflation stays sticky.
Discouraged workers at 476,000 and 5.9 million people who want a job but remain outside the force form a latent pool. Whether those groups return will decide if today’s low break-even bar is temporary or structural. The July report does not settle that question; it only shows how much the bar has already moved.
Bitcoin and Risk Assets Took the Dovish Read
Bitcoin traded near $65,200, up roughly 2 percent on the day after earlier-week softness tied to hike fears. Equities rallied: the S&P 500 closed at a record, up about 0.6 percent, while the Nasdaq gained near 1.3 percent. Treasury yields fell, the dollar slipped, and gold jumped more than 2 percent.
Prediction markets moved fast. Polymarket showed a 55 percent chance of a 2026 hike, down sharply from recent highs near 77 percent. The September no-change probability near 63 percent rose from roughly 50 percent the day before. LSEG data put September hike odds around 44 percent after the print, from 57 percent beforehand. The pattern echoes earlier jobs-report swings in Bitcoin and stands in contrast to recent jobless claims capping Bitcoin under 65k.
| Market signal | After July jobs | Before / recent high |
|---|---|---|
| Bitcoin | near $65,200 (+2%) | earlier-week softness on hike fears |
| Polymarket 2026 hike | 55% | near 77% |
| September no-change | near 63% | roughly 50% prior day |
| LSEG September hike | around 44% | 57% beforehand |
| S&P 500 | record, about +0.6% | – |
| Nasdaq | near +1.3% | – |
Fed funds futures and prediction markets still leave room for later tightening. Bank of America economists kept a call for 75 basis points of hikes this year, arguing inflation remains the priority. The Iran conflict continues to support energy prices and keep inflation well above the 2 percent target.
Cross-asset moves lined up with a classic dovish surprise: lower yields, a softer dollar, stronger gold, and risk assets bid. Bitcoin’s push back through $65,000 reversed the tone set when jobless claims had capped the price under that level. The jobs print flipped the same narrative the claims data had reinforced only days earlier.
The Fed Almost Never Hikes After Job Losses
History supplies the sharper edge. Analyst Warren Pies noted the central bank has raised rates after a negative jobs report only twice (November 1999 and November 2005) out of 89 meetings that followed negative payroll growth. Another employment report lands before the September FOMC.
The Fed has only hiked twice following a negative jobs report (Nov 1999 and Nov 2005). This is out of 89 Fed meetings immediately following negative jobs growth.
Pies’s tally, widely shared on X, matches the market’s immediate pricing. Chair Kevin Warsh has offered little forward guidance, so each data print now moves odds more violently. Three FOMC members already dissented in favor of a hike at the last meeting. Soft labor data historically makes that path harder to sustain, especially when private hiring is still positive and wage growth is cooling.
Two hikes in 89 meetings is a thin precedent. Markets treated that record as binding for September even while full-year hike odds stayed nearer a coin flip. The dissent camp still has a live case if inflation re-accelerates, but a negative payroll print plus cooler wages raises the bar those members must clear.
With another employment report due before the September meeting, July is not the last word. It does reset the burden of proof. A hold becomes the path of least resistance unless the next labor print or the inflation data reverse the signal.
Banks Still Call Hikes as Markets Price a Hold
The split between street research and market pricing is now the live tension. Bank of America still pencils in 75 basis points of hikes this year on the view that inflation remains the priority. Prediction markets and futures cut near-term odds hard after the payroll miss, with the September no-change probability near 63 percent and LSEG September hike odds around 44 percent.
Both sides can point to pieces of the same report. Doves cite the 23,000 headline loss, the 103,000 two-month revision, participation at a multi-year low, and wages at 3.2 percent. Hawks cite still-positive private hiring, unemployment only at 4.1 percent, and inflation held above the 2 percent target by the Iran conflict’s energy premium.
- Market path: September hold odds up; 2026 hike chance down to 55 percent from near 77 percent
- Bank path: 75 basis points of hikes still on some year-ahead forecasts
- Shared open question: whether CPI and PPI next week confirm or reject the dovish shift
Chair Warsh’s limited forward guidance amplifies each release. Without a thick communications buffer, payrolls and prices trade as direct inputs to the odds. That is why Bitcoin, equities, and gold all moved together when the July numbers hit: the print changed the conditional probability of a hike before any FOMC speaker could reframe it.
History favors the market’s immediate read. The private-sector cushion and cooling wage growth give the committee cover to wait. Sticky inflation and the earlier dissent keep the bank calls from vanishing. Next week’s price data decide which side blinks first.
Inflation Data Arrive Next and Will Decide the Bet
CPI and PPI land next week and will dominate the September debate. Inflation has run above target for years; the war premium in energy keeps the risk alive. Markets are treating the jobs miss as permission to stay on hold, yet several houses still pencil in later hikes if price data re-accelerate.
What we know
- July payrolls -23,000, private +30,000, education drag large
- Revisions cut May-June by 103,000
- Participation at multi-year low; wage growth slowed to 3.2 percent
- September hike odds down materially; full-year still near coin-flip
What’s unconfirmed
- Whether education weakness reverses in August
- How much of the labor-force drop is lasting policy-driven supply loss
- Whether next week’s inflation prints keep or reverse the dovish shift
The same tension appeared in Warsh-era stagflation risk flags: sticky prices against a cooling, supply-constrained labor market. For now the historical pattern and the private-sector cushion are carrying the day for Bitcoin and equities.
If CPI and PPI cool, the July jobs miss becomes the anchor for a hold through September and the dovish repricing in Bitcoin and equities can extend. If they re-accelerate, the 15,000-50,000 break-even band will not stop hawks from arguing that supply-side tightness is already an inflation problem. The report resolved the labor side of the tape; it left the price side wide open.
Frequently Asked Questions
How many jobs did the U.S. lose in July 2026?
Nonfarm payrolls fell by 23,000. Private payrolls still rose 30,000; the headline was dragged lower mainly by a 50,000 drop in local government education and losses in retail and leisure.
Why did the unemployment rate fall if payrolls declined?
Roughly 264,000 people left the labor force, so fewer workers were counted as unemployed. Participation fell to 61.4 percent, a near multi-year low, which mechanically lowered the jobless rate even as household employment dropped.
How large were the revisions to prior months?
May was revised down 66,000 to +63,000 and June down 37,000 to +20,000, a combined 103,000 reduction. That left the recent three-month average near 20,000 jobs.
Did wage growth slow in the July report?
Yes. Average hourly earnings rose only 2 cents on the month to $37.62 and 3.2 percent over the year, down from 3.4 percent previously, removing one near-term inflation pressure.
Is a July job loss unusual in recent history?
It was the first monthly decline in five months and one of the larger losses since 2020. Soft summer prints have now appeared three years in a row, often tied to education seasonal factors that later reverse.
The report is final; the rate decision is not. History and the private-sector detail currently favor a hold, and Bitcoin has priced that wager first.


Majors Fights Campus Caliphate as Daily Wire Ambitions Fray

Uber Bets $10 Billion Cash on Robotaxi Platform Play

Ahbstra ARK Pulls 500 Litres Daily From Dry Mediterranean Air

Nest Thread 1.4 Quietly Unifies Multi-Brand Smart Home Meshes

Cable Gateways Push Wi-Fi 7 Past Early Adopters in the US

Pixel Quick Settings Finally Gets Full Layout Reorder in Canary 2608

WhiteBIT Spot Bots Fill UK Gap Left by Derivatives Ban

Motorola Edge 70 Neo Leak Doubles Down on Bold Pantone Colors

Platter Turns Food Spreadsheets Into Sticky Supply Infrastructure

Circle Puts Native USDC on OKX X Layer for AI Rails

Marker AI Writing Startup Lands $13M Seed Led by Index Ventures

Meta’s Muse Spark 1.1 Beats Rivals on Price, Trails on Coding

CS2 Premier Season 5 Lands With Cache and a C4 Damage Rework

Bessent’s No-CBDC Applause Line Can’t Save the CLARITY Act

Trump Iran Threat Wiped $238M Crypto Longs Then Flipped

CLARITY Act Odds Crash as Democrats Reject DOJ Ethics Plan

Nintendo’s Switch 2 Battery Fix for Europe Comes With a Catch

Audi’s 2026 S5 Bets That Restraint Beats the Horsepower Wars

Quantum Systems’ $1.2 Billion Round Exposes Defense Tech’s Winner Gap

OpenAI Agent Cheated Its Own Test by Hacking the Web
-
 FINANCE2 months ago
Zcash Patched a Double-Spend Bug as ZEC Climbed 5%
-
 ENTERTAINMENT2 months ago
Steam Summer Sale 2026 Locks In June 25 to July 9 Dates
-

 FINANCE1 month ago
CLARITY Act Final Text Expected This Weekend as 60-Vote Hurdle Looms
-
 NEWS3 months ago
Meta Adds AI Replies to Threads, But Users Can’t Block It
-
 NEWS5 months ago
U.S. Navy Deploys Solar-Powered Lightfish Drone to Patrol Oceans
-
 ENTERTAINMENT3 months ago
‘Widow’s Bay’ Review: Apple TV’s Sleeper Horror-Comedy Earns Its Fog
-
 FINANCE2 months ago
CLARITY Act Floor Vote Likely Shifts to August, Lummis Says
-

 FINANCE1 month ago
Kalshi Loses Major NY Prediction Markets Ruling to Judge Torres